Behavioral Analytics and Search Data-Driven Marketing
We’re back at the Online Marketing Summit track that expands beyond search and ties it into e-mail, display, or in this case, behavioral targeting and analytics. Aaron asks the audience what they’re looking to walk away from this session with.
- Technology and products to better track visitor behavior
- Understanding who our audience is and what their behavior is before they get to the site.
- Audience virtualization and real-time bidding
Speakers:
Jason Shulman, chief revenue officer, [x + 1]
Ingrid Sanders, director, AdAdvisor, TARGUSinfo
Thomas Koletas, SVP Ad Programs, Madison Logic
Ingrid will present first. She’s going to talk about third-party data in the online ad landscape and how to use data to drive enhanced performance and conversions, specifically through display media. This same data can be leveraged for optimization of other online marketing channels.
The reason she’s in the data space is because she recognized early enough that online data was going to drive marketing going forward.
Why the buzz about data?
- Technology is driving new opportunities: We’ve reached the point where third-party data can be implemented for good reasons.
- “Old” media buying model: Advertisers used to use the publisher’s content as a proxy for identifying the right audience to reach. Now advertisers have a more sophisticated understanding of what the ad is worth to them.
- How the model is changing: It may make sense to look at other channels to reach the same objectives.
- When third-party data makes sense
- Direct marketing
- Brand marketing
Key data sources today:
Search
Demographics
Behavioral or in-market data
Pros:
- Widely available today across partners
- Similar to offline targeting
- Easy to deploy
- Can help indicate in-market status
Cons:
- No industry standards
- One dimensional consumer view
- Inferred consumer interests
- Can be difficult to scale performance
Additional data sets available:
- Search retargeting
- Social graph and influencer
- Vertical data sets
- Advertiser specific
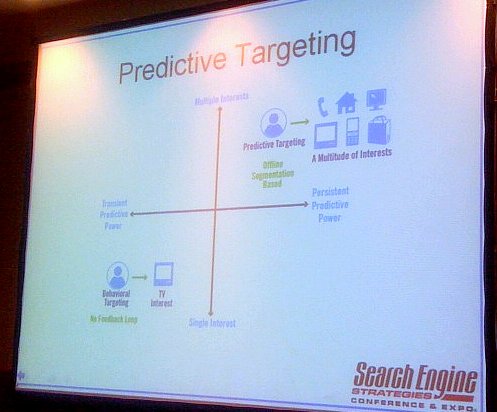
This data tends to be much more stable because you’re looking at multiple views of a consumer and can have more confidence that what you’re doing to reach that user works.
Where to access third-party data depends on the level of sophistication internally for display media buying. It’s available through publishers, ad networks, demand side platforms and optimizers.
Closing the feedback loop:
- Ensure you are reaching the right consumers
- Optimize against context and creative that performs best
- Develop insights to fuel future campaigns
She highly recommends AdExchanger.com for more on the changes taking place in the industry.
Thomas is our next presenter. Why B2B? That’s where the money is! As online revenues continue to grow, B2B ad spend on social media and lead generation sites is also forecast to grew at an annualized rate of 21 percent and 17 percent, respectively, to 2013.
What happens now?
Advertiser engages in separate, lengthy negotiations with individual lead gen sources, i.e. individual publisher sites, ad networks, etc.
Each insertion order has
How do we solve the problems with b2b lead gen?
- Lead gen should be advertiser size agnostic
- Pricing should be based on market needs
- Pricing should be based on audience filters
Jason steps up next. Marketers today are focused on capturing and measuring
- Intentions: serving messages in real time based on assumed intentions of the consumer
- Mentions: the things people say about your brand are more important than what you say
[x + 1] is a platform that lets you optimize the whole digital touch point.
Attribution for multi-stage conversion process:
Dynamics:
- To scale, client added CPA for free trial
- CPA providers bombarded the remarketing pool, gaining credit for last view.
- Non-CPA providers lost shares of sales and had their budgets cut and their credited CPA’s went up
- Remarketing pool shrank, sales flattened at a higher overall cost.
Better approach:
- For each provider, measured unique contribution to reach overall and to remarketing reach
- Rewarded trial drivers and reach providers and eliminated remarketing for all but one partner.
Unique reach and frequency analysis
Reach and frequency reporting includes
Reach and freq by publisher/section
Reach and freq [… missed the rest of this point…]
Converter overlap – report uses
- Asses the relative attribution credit of conversions by site.
- Assess the effectiveness of the site to generate conversions on a weighted basis.
Case Study: Over attribution to search. The client search team claimed almost all the conversions on the site – 16 percent.
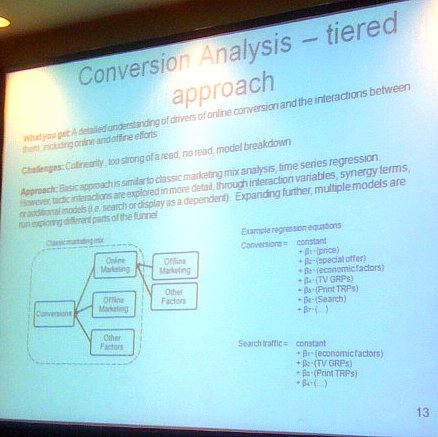
Statistical analysis found that 38 percent of those would have occurred anyway and 15 percent of the rest were due to synergy with offline channels.
Precedent analysis
Cross-channel attribution report includes:
% of unique converters seen in each channel by conversion type

LEAVE A REPLY


